Evaluating the Infocharts UI Elements Kit for Modern Data Visualization
In the current landscape of digital product design, the ability to present complex data clearly is often just as important as the underlying functionality of an application. The Infocharts UI Elements Kit addresses this specific intersection of analytics and interface design by providing a comprehensive suite of visualization assets tailored for dark-themed environments. Rather than offering generic chart templates, this resource focuses on the nuanced requirements of modern dashboards and mobile applications where screen real estate is limited and visual hierarchy is paramount. For professionals tasked with building analytical tools, fintech apps, or marketing reports, understanding the practical utility of this kit requires looking beyond its aesthetic appeal to examine its structural flexibility and integration potential.
Core Components and Visual Architecture
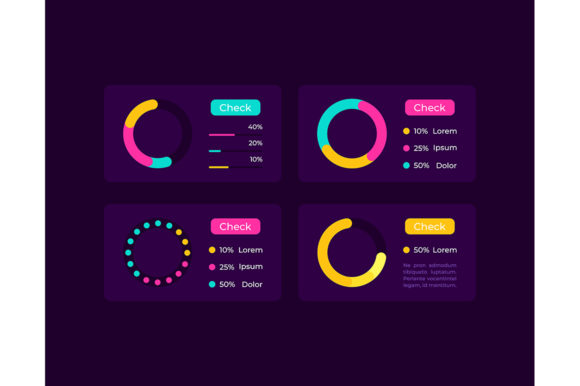
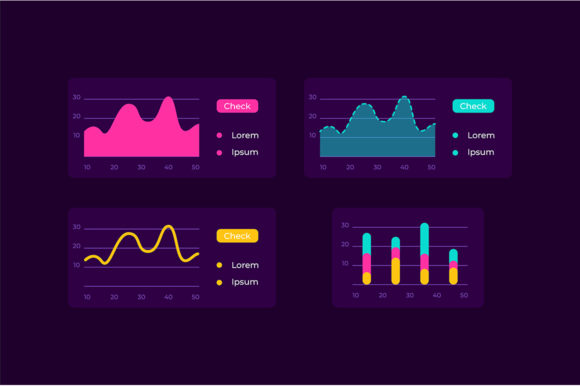
The primary value proposition of the Infocharts UI Elements Kit lies in its specialized focus on dark mode interfaces. While many UI kits provide light and dark variations as an afterthought, this collection appears engineered specifically for low-light environments. This distinction matters significantly because data visualization in dark themes presents unique challenges regarding contrast ratios, color vibration, and readability. The included line charts, bar graphs, and infographic analysis icons utilize color palettes and stroke weights that maintain legibility against deep backgrounds without causing eye strain during extended use.
The kit encompasses a diverse range of widget types essential for dashboard construction. Beyond standard line and bar charts, it includes isolated vector icons for infographic analysis and complete dashboard templates. These are not merely static images; they are structured compositions that demonstrate how individual elements relate to one another within a cohesive layout. For mobile application design, the widgets are scaled and spaced to accommodate touch targets and responsive behavior, acknowledging that data consumption on handheld devices differs fundamentally from desktop analysis. The inclusion of both granular icons and macro-level templates allows designers to work at multiple levels of fidelity simultaneously.
File Format Versatility and Workflow Integration
A critical factor in evaluating any design asset is its compatibility with existing workflows. The Infocharts UI Elements Kit is delivered as a ZIP archive containing EPS, JPG, PNG, SVG, and AI files. This multi-format approach supports a wide spectrum of users, from vector-based UI designers to marketers needing quick rasterized assets for presentations.
- SVG (Scalable Vector Graphics): Essential for web and mobile development, SVGs allow for infinite scaling without quality loss and can be styled via CSS. This format is crucial for implementing the kit’s dark theme dynamically in code.
- AI and EPS: These source files cater to Adobe Illustrator users who need to modify the fundamental geometry of the charts or adapt the style guide to match specific brand guidelines.
- PNG and JPG: While less flexible for development, these raster formats serve immediate needs for wireframing, client mockups, or documentation where vector editing is unnecessary.
The availability of editable source files (AI/EPS) transforms this product from a simple clip-art pack into a foundational design system component. Designers can extract global styles, adjust grid systems, and repurpose the underlying logic of the charts for custom data sets. This extensibility is what separates professional-grade UI kits from disposable graphic resources.
Practical Application in Real-World Projects
When integrating the Infocharts UI Elements Kit into active projects, several practical strengths emerge. The most immediate benefit is time efficiency in the prototyping phase. Constructing accurate, aesthetically pleasing data visualizations from scratch is labor-intensive. Having pre-designed, consistent widgets allows teams to move rapidly from concept to high-fidelity mockup. This is particularly valuable for startups and freelancers operating under tight deadlines where custom illustration is a luxury.
Furthermore, the kit enforces visual consistency across different data types. A common pitfall in dashboard design is the disjointed appearance that occurs when line charts, bar graphs, and KPI cards are sourced from different libraries or created by different designers. The unified stylistic language of this kit ensures that a pie chart and a trend line feel like parts of the same system. This coherence reduces cognitive load for end-users, allowing them to focus on interpreting data rather than deciphering inconsistent visual cues.
For mobile developers and designers, the kit’s attention to compact layouts is a significant advantage. Mobile dashboards often suffer from overcrowding or excessive simplification. The widgets in this collection strike a balance, providing enough detail to be useful while respecting the constraints of smaller screens. The isolated vector icons for infographic analysis are particularly handy for creating summary views or navigation elements that link to deeper analytical sections without consuming valuable viewport space.
Assessing Quality and Customization Limits
While the Infocharts UI Elements Kit offers substantial utility, it is important to approach it with realistic expectations regarding customization. As with any pre-made asset library, there is an inherent trade-off between convenience and bespoke specificity. The dark theme is optimized for general use, but teams with strict accessibility standards (such as WCAG AAA compliance) will still need to audit and potentially adjust color contrasts. The provided colors are a strong starting point, but they should be validated against specific background shades used in your production environment.
Additionally, while the AI and SVG files are editable, the complexity of the vector structures may vary. Some charts may be constructed with clean, semantic grouping that makes modification straightforward, while others might require more manual cleanup depending on how they were originally authored. Professionals should expect to spend some time deconstructing the templates to fully understand their anatomy before adapting them for unique data scenarios. This is not a flaw of the kit per se, but a standard reality of working with third-party vector assets.
Target Audience and Strategic Fit
Determining whether this kit is a worthwhile investment depends largely on your role and current project requirements. The Infocharts UI Elements Kit is best suited for specific segments of the creative and technical workforce:
- UI/UX Designers in Fintech and SaaS: Professionals designing data-heavy applications will find the most value here. The dark theme alignment matches industry standards for trading platforms, analytics tools, and monitoring dashboards.
- Freelancers and Agency Teams: For those managing multiple clients, having a reliable, high-quality chart library accelerates delivery times and maintains a professional standard across diverse projects.
- Product Managers and Marketers: Even non-designers can leverage the PNG and SVG assets to create compelling pitch decks, internal reports, or blog content that looks polished without requiring extensive design skills.
- Educators and Content Creators: Those producing courses or tutorials on data literacy or business analytics can use these visuals to illustrate concepts clearly, maintaining viewer engagement through professional aesthetics.
Conversely, this kit may be less suitable for projects requiring light-mode-first designs or highly specialized scientific visualizations outside the scope of standard business analytics. It is also worth noting that while the kit provides the visual representation of data, it does not include functional code libraries or JavaScript components. Developers will still need to implement the actual charting logic using frameworks like D3.js, Chart.js, or proprietary solutions, using these assets purely as a visual reference or static fallback.
Long-Term Value and Maintenance
The longevity of a UI kit is determined by its timelessness and adaptability. The Infocharts UI Elements Kit leans toward functional minimalism rather than trendy decoration, which bodes well for its shelf life. Dark interfaces have moved from niche preference to industry standard, suggesting that these assets will remain relevant for the foreseeable future. However, users should view this kit as a foundation rather than a complete solution. Design trends evolve, and data visualization best practices shift. The true long-term value comes from learning the principles embedded in the kit—spacing, color usage, hierarchy—and applying those lessons to future custom work.
Ultimately, the Infocharts UI Elements Kit represents a pragmatic solution for professionals who need to bridge the gap between raw data and user experience. It eliminates the friction of designing basic analytical components from scratch, allowing teams to focus their creative energy on solving unique user problems. By providing a robust set of editable, dark-themed assets in multiple formats, it supports a wide range of workflows and skill levels. For those regularly tasked with making numbers look intelligible and attractive on screens, this collection offers a reliable, efficient, and professionally executed resource that justifies its place in a modern design toolkit.