Visualizing Wearable Tech: Leveraging Smartwatch Attributes Vector Infographics for Modern Design
The wearable technology market has evolved from simple fitness tracking to complex ecosystems involving mobile payments, AI-driven virtual assistants, and comprehensive health monitoring. For marketers, product managers, and UI/UX designers, communicating this density of features requires more than a standard spec sheet. It demands visual clarity. This is where a Smartwatch Attributes Vector Infographic becomes an essential asset in your creative toolkit. Rather than forcing audiences to wade through dense paragraphs of technical jargon, these vector-based templates translate sophisticated functionality into digestible, scalable graphics that maintain crispness across everything from mobile screens to large-format trade show banners.
The Strategic Value of Vector-Based Data Visualization
When designing for tech products, resolution independence is non-negotiable. Raster images pixelate when scaled, but vector formats ensure that every line, icon, and text element remains mathematically perfect regardless of size. A high-quality smartwatch infographic template typically includes a comprehensive suite of file formats within a single ZIP archive: EPS, JPG, PNG, SVG, and AI. Understanding when to use each format is part of the practical workflow.
- AI and EPS: These are your source files for Adobe Illustrator or compatible vector software. They allow for deep customization, enabling you to change color palettes to match brand guidelines or adjust node points to fit specific device silhouettes.
- SVG: Scalable Vector Graphics are crucial for web implementation. They keep page load times low while ensuring icons look sharp on Retina displays and high-DPI monitors.
- PNG and JPG: While not editable vectors, these raster exports serve as immediate placeholders for presentations, social media teasers, or internal stakeholder reviews before final production assets are ready.
This multi-format approach ensures that the design asset fits seamlessly into diverse workflows, from initial concept pitching to final marketing deployment.
Showcasing Core Functionalities: Payments and Virtual Assistants
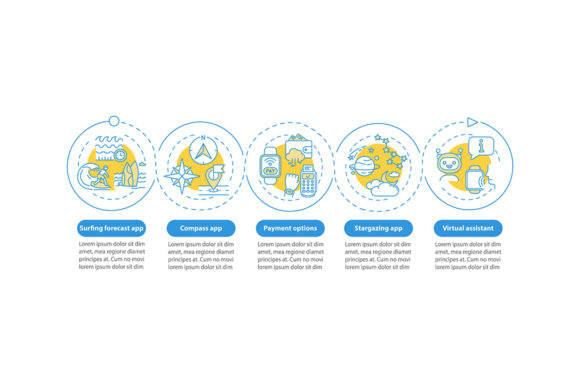
Modern smartwatches are defined by their interaction models. Two of the most critical attributes to visualize are contactless payment systems and virtual assistant integration. These features represent the bridge between hardware and daily utility, yet they are abstract concepts that benefit significantly from iconography.
A well-designed smartwatch attributes vector infographic template addresses this by providing dedicated presentation design elements for these functions. For payment visualization, effective designs often utilize NFC wave symbols, secure lock icons, or stylized credit card overlays positioned near the watch face. This instantly communicates financial capability without needing explanatory text. Similarly, virtual assistant features are best represented through voice waveform graphics, microphone icons, or chat bubble motifs that suggest active listening and AI processing.
When selecting a template, look for modularity. You should be able to swap a generic payment icon for a specific brand logo (like Apple Pay or Google Wallet) or customize the assistant’s visual representation to match your product’s unique AI persona. This flexibility transforms a generic stock asset into a bespoke communication tool that accurately reflects your specific value proposition.
Structuring Complexity with 5-Step Process Timelines
One of the greatest challenges in tech marketing is explaining user journeys or setup processes without overwhelming the viewer. Whether you are illustrating how a user syncs their watch, configures health sensors, or activates a subscription service, linear progression is key. The 5-step data visualization model found in premium infographic templates offers a proven framework for this narrative.
This layout typically arranges five distinct nodes in a horizontal or curved timeline, connected by directional flow lines. Each step combines a linear icon with a concise label and optional subtext. Practical applications for this structure include:
- Unboxing to Activation: Visualizing the physical removal, pairing via Bluetooth, account creation, firmware update, and first-use calibration.
- Health Metric Analysis: Showing the flow from sensor detection to data processing, cloud synchronization, app visualization, and actionable insight generation.
- Ecosystem Integration: Demonstrating how the watch connects to phones, smart home devices, cloud services, third-party apps, and wearable accessories.
The linear icon style commonly used in these timelines reduces visual noise. Unlike detailed skeuomorphic illustrations, linear icons prioritize recognition speed. They guide the eye naturally from left to right, creating a cognitive pathway that mirrors the actual user experience. When customizing these templates, ensure adequate whitespace between steps; cramming information defeats the purpose of process visualization.
Workflow Layouts and Linear Icon Systems
Beyond sequential timelines, smartwatch attribute infographics must also handle parallel feature sets. Workflow layouts with linear icons provide a grid or modular arrangement ideal for comparing specifications or highlighting multiple capabilities simultaneously. This is particularly useful for landing pages, pitch decks, or packaging inserts where space is limited but information density is high.
Linear icons excel here because of their visual consistency. A cohesive icon set maintains uniform stroke weights, corner radii, and negative space ratios. This systematic approach signals professionalism and attention to detail—qualities that consumers subconsciously associate with hardware reliability. When evaluating a Smartwatch Attributes Vector Infographic package, verify that the included icons share this stylistic unity. Mixing disparate icon styles can make even premium hardware appear disjointed or hastily assembled.
These workflow layouts also support responsive design adaptation. Because they are vector-based, individual modules can be rearranged for vertical mobile layouts or expanded for horizontal desktop views without redrawing assets. This adaptability is crucial in omnichannel marketing environments where the same core message must flex across dozens of touchpoints.
Practical Considerations for Template Selection and Customization
Not all infographic templates are created equal. Before downloading a ZIP file, consider several practical factors that will impact your long-term usability. First, assess the layer organization within the AI or EPS files. Well-structured templates use named layers, grouped elements, and global color swatches. This organizational discipline saves hours of untangling messy artwork when you need to make quick revisions under deadline pressure.
Second, evaluate the conceptual breadth of the included attributes. Does the template only cover basic fitness metrics, or does it extend to enterprise use cases, medical-grade monitoring, developer tools, and lifestyle integrations? Broader coverage provides better ROI since the same asset library can serve multiple campaigns over time.
Third, consider licensing and attribution requirements. Commercial projects demand clear usage rights. Ensure the template license permits modification, redistribution in compiled formats, and use across digital and print media without restrictive limitations. Professional teams cannot afford legal ambiguity when launching product campaigns.
Finally, think about accessibility. Vector infographics should be designed with sufficient contrast ratios and legible typography sizes. When exporting SVGs for web use, include proper ARIA labels and title tags so screen readers can interpret the visual content. Beautiful design that excludes users with visual impairments fails both ethically and commercially in today’s inclusive digital landscape.
Integrating Infographics into Broader Marketing Ecosystems
A smartwatch attributes vector infographic template achieves maximum impact when treated as a system rather than a standalone graphic. Extract individual icons for use in email newsletters, repurpose timeline sections for video motion graphics, and adapt workflow layouts for investor presentations. The vector foundation enables this cross-pollination effortlessly.
Consider also how these visuals support SEO and content marketing efforts. Search engines increasingly value rich media that enhances user engagement. Embedding optimized SVG infographics with descriptive alt text and surrounding contextual content signals topical authority. When users spend more time interacting with visual explanations of smartwatch features, bounce rates decrease and dwell time increases—both positive ranking signals.
Moreover, consistent visual language across all materials builds brand recognition. When customers encounter the same iconography on your website, in-store displays, app interfaces, and advertising, they develop intuitive associations that reduce cognitive friction during purchase decisions. The upfront investment in a quality vector template pays dividends through this accumulated familiarity.
Ultimately, effective smartwatch visualization balances aesthetic appeal with informational precision. It respects the complexity of modern wearable technology while honoring the audience’s need for clarity. By leveraging professionally crafted vector infographic templates with comprehensive format support, thoughtful icon systems, and adaptable layouts, teams can communicate sophisticated product attributes with confidence and consistency across every channel where their customers engage.