Visualizing the Why: Practical Applications of a Procrastination Causes Infographic
Understanding why we delay tasks is often more complex than simply admitting a lack of willpower. A Procrastination Causes Infographic serves as a visual bridge between abstract psychological concepts and actionable self-awareness. Rather than reading dense academic papers on temporal motivation theory or executive dysfunction, professionals and students can leverage these visual tools to quickly identify specific behavioral blockers. When utilizing a high-quality procrastination causes vector infographic template, the goal is not just to display data, but to create a mirror in which viewers can recognize their own patterns of avoidance, perfectionism, or overwhelm.
These visual assets typically break down complex emotional states into digestible components. For instance, a well-designed layout might categorize causes into fear of failure, task aversion, poor time management, and external distractions. By presenting this information through linear icons and clean typography, the stigma often associated with procrastination is reduced. It transforms a personal failing into a solvable workflow problem. This shift in perspective is essential for adults aged 20 to 50 who are navigating high-pressure careers, academic pursuits, or entrepreneurial ventures where time is a finite and valuable resource.
Real-World Scenarios for Visualizing Delay
The true value of these design elements emerges when they are applied to specific, high-stakes environments. Different industries and professional roles face unique flavors of procrastination, and a generic approach rarely resonates. Adapting a vector template to fit a specific context makes the difference between a pretty picture and a functional diagnostic tool.
Corporate Training and HR Workshops
In corporate settings, productivity loss due to procrastination costs billions annually. However, telling employees to "just focus" is ineffective. Human Resources professionals and team leaders can use a process timeline chart during wellness or productivity workshops to facilitate open discussions. Instead of accusing staff of laziness, a facilitator can point to a specific icon representing "perfectionism" or "unclear goals" and ask, "Which of these feels most familiar right now?"
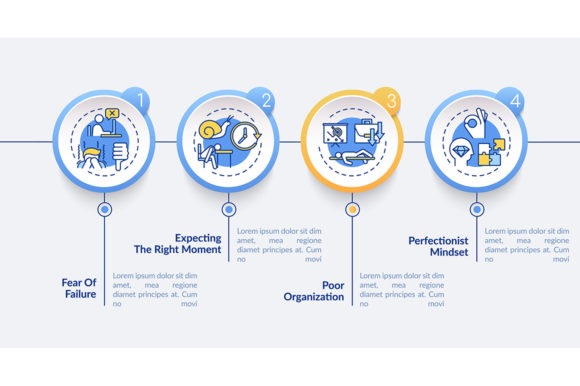
This visual prompt creates psychological safety. It allows teams to identify systemic issues—such as vague project briefs causing paralysis—rather than blaming individual character flaws. The 4-step data visualization format is particularly effective here, as it mirrors standard business process flows, making the content feel native to a corporate environment rather than clinical or judgmental.
Academic Counseling and Student Success
University counselors and academic coaches frequently encounter students paralyzed by thesis writing or exam preparation. A static list of advice is easily ignored by an overwhelmed student. Conversely, a colorful, structured infographic can serve as a handout or digital resource that students return to repeatedly. By customizing the template to reflect academic-specific triggers like "research rabbit holes" or "imposter syndrome," educators provide a tangible roadmap out of avoidance.
The inclusion of waiting and perfectionism presentation design elements is crucial in this demographic. Students often mistake the need for more research (waiting) for productive work, or they delay starting because they believe the first draft must be flawless. Visualizing these distinct traps helps students differentiate between necessary preparation and active avoidance.
Personal Development and Coaching
Life coaches and therapists working with adult clients can use these vectors as session aids. When a client struggles to articulate why they haven't started a business or ended a relationship, pointing to a visual representation of "fear of success" or "decision fatigue" can unlock breakthroughs. The ZIP file formats (EPS, AI, SVG) allow coaches to edit the text and colors to match their branding or the specific language their client uses, creating a bespoke therapeutic tool.
Leveraging the 4-Step Data Visualization Framework
Most effective procrastination templates utilize a four-step structure because it aligns with cognitive processing limits. When designing or selecting a template, consider how this framework translates to practical problem-solving:
- Step 1: Identification. The first quadrant usually focuses on recognizing the trigger. In practice, this means ensuring the icons are universally recognizable. A clock icon might represent time anxiety, while a tangled knot could symbolize confusion. Clarity here prevents misinterpretation.
- Step 2: Emotional Response. Procrastination is an emotional regulation issue, not a time management one. Effective infographics visualize the feeling associated with the delay, such as guilt or anxiety. This validates the user's experience before offering solutions.
- Step 3: The Consequence Loop. Showing the short-term relief versus long-term pain helps users understand the cycle. A workflow layout that visually connects avoidance to increased stress reinforces why breaking the habit matters.
- Step 4: Intervention Strategy. The final step should offer a concrete action. Whether it is "break tasks down," "set a timer," or "seek accountability," this step turns the infographic from a passive observation into an active plan.
Technical Considerations for Customization
When downloading a ZIP file containing EPS, JPG, PNG, SVG, and AI formats, understanding which file to use is vital for maintaining professional quality across different mediums. While JPG and PNG are sufficient for quick social media posts or internal emails, they lack the flexibility needed for serious adaptation.
For print materials, workshop slides, or high-resolution web content, the EPS or AI files are non-negotiable. These vector formats allow you to scale the linear icons infinitely without pixelation. More importantly, they enable color manipulation. If your organization uses a specific blue to denote trust and calm, you can recolor the entire infographic to match, reinforcing brand consistency and psychological cues simultaneously.
SVG files have become increasingly important for digital-first audiences. They are lightweight, scalable, and can even be animated with CSS for interactive web experiences. Imagine a webpage where hovering over the "Perfectionism" icon reveals a tooltip with a specific coping strategy. This level of interactivity significantly increases engagement compared to a static image, making the content more memorable for digital-native users.
Strengths and Limitations in Practice
While a Procrastination Causes Infographic is a powerful communication device, it is important to manage expectations regarding its utility. The primary strength lies in its ability to normalize and categorize. It provides a shared vocabulary for teams and individuals to discuss difficult behaviors without shame. The visual nature bypasses the defensive barriers that text-heavy explanations often trigger.
However, a limitation exists in oversimplification. Procrastination is deeply personal and often comorbid with conditions like ADHD, depression, or trauma. A standardized template cannot capture every nuance of human psychology. Users should view these graphics as starting points for conversation or self-reflection, not as comprehensive diagnostic instruments. When using these templates, always leave space for customization or add disclaimers if the content is being used in a mental health or medical context.
Furthermore, the aesthetic style matters. Overly cartoonish illustrations may undermine the seriousness of the topic in a boardroom setting, while overly clinical diagrams might alienate creative professionals. Selecting a template with a balanced, modern aesthetic ensures the message lands appropriately with the intended audience. The best designs strike a tone that is empathetic yet professional, acknowledging the struggle while projecting confidence in the solution.
Moving From Awareness to Action
Ultimately, the purpose of integrating these design elements into your workflow is to reduce friction. Whether you are a manager trying to improve team output, a student battling thesis paralysis, or a content creator explaining productivity hacks, the visual format accelerates understanding. By utilizing editable vector templates, you ensure that the resource remains relevant and adaptable to evolving needs.
The transition from waiting to doing begins with clarity. When we can see our obstacles clearly, mapped out in a logical workflow with linear icons and clear steps, they cease to be insurmountable monsters and become manageable variables. The right infographic doesn't just explain procrastination; it organizes the chaos of avoidance into a structured path forward, empowering users to reclaim their time and agency through better visual communication.