Evaluating the Better Sleep Recommendation Infographic for Healthcare Communication
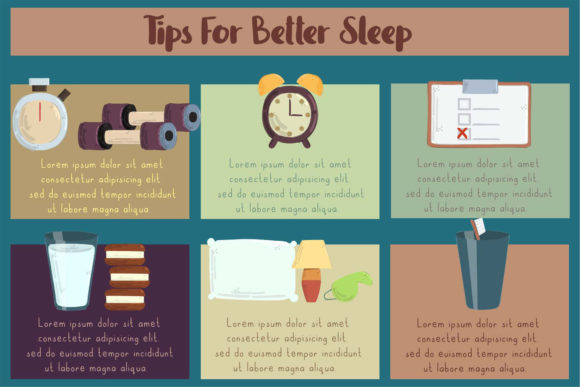
Visualizing health data requires a delicate balance between clinical accuracy and public accessibility. The Better Sleep Recommendation Infographic serves as a specialized design asset intended to bridge this gap, translating complex sleep hygiene protocols into an accessible five-step process timeline. For healthcare professionals, educators, and content creators, selecting the right visual aid is not merely an aesthetic choice but a functional one that impacts patient comprehension and retention. This specific vector infographic template distinguishes itself through its structured workflow layout and linear iconography, designed specifically for medical and wellness presentations. However, like any design resource, it possesses distinct strengths and limitations depending on the intended audience and distribution channel. Understanding where this template fits within the broader ecosystem of health communication tools is essential for making an informed selection.
Distinguishing Features of Structured Sleep Hygiene Visuals
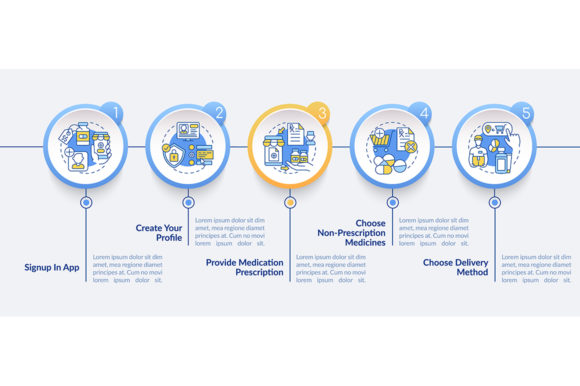
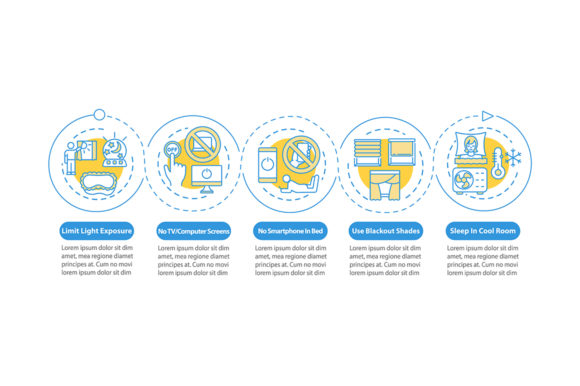
The primary differentiator of the Better Sleep Recommendation Infographic is its adherence to a linear, five-step logic model. Unlike general wellness illustrations that may use circular or radial layouts to suggest holistic balance, this template utilizes a process timeline chart. This structural choice implies causality and sequence, which is particularly effective for behavioral interventions where order matters. For example, establishing a wind-down routine must logically precede the act of falling asleep. The linear workflow guides the viewer’s eye from left to right or top to bottom, reinforcing the narrative of preparation leading to rest.
Furthermore, the inclusion of healthcare-specific presentation design elements sets this asset apart from generic lifestyle graphics. The linear icons are typically rendered with consistent stroke weights and neutral geometry, avoiding the playful or cartoonish aesthetics often found in consumer-facing sleep apps. This professional visual language signals credibility and aligns with clinical standards. When comparing options, users should assess whether their audience responds better to authoritative medical styling or softer, illustrative approaches. The vector format (available in EPS, AI, and SVG) ensures that these clean lines remain crisp at any scale, from a printed clinic poster to a high-resolution digital display, whereas raster-based alternatives often degrade when resized for different media.
Comparing Vector Templates Against Custom and Stock Alternatives
When sourcing visual assets for sleep education, decision-makers generally evaluate three categories: custom-commissioned design, generic stock photography, and specialized vector templates like this one. Each category presents unique tradeoffs regarding cost, time, and relevance.
Custom Design vs. Templated Assets: Commissioning a bespoke illustration allows for complete alignment with specific brand guidelines and proprietary research data. However, this route is resource-intensive and slow. The Better Sleep Recommendation Infographic offers a middle ground by providing editable source files (AI/EPS). Users can modify colors, swap icons, and adjust text to match their institutional identity without starting from scratch. While it lacks the exclusivity of custom art, it reduces production time from weeks to hours. If your sleep recommendations deviate significantly from standard hygiene practices, a template may require excessive modification, making custom design more viable. Conversely, if your content aligns with established consensus, the template provides immediate utility.
Vector Graphics vs. Photographic Imagery: Stock photos of sleeping individuals are emotionally resonant but often fail to convey actionable information. A photograph can depict "rest," but it cannot easily illustrate the physiological impact of blue light reduction or caffeine timing. The Better Sleep Recommendation Infographic excels in instructional clarity. Data visualization principles dictate that abstract concepts are best represented through symbolic iconography rather than literal imagery. If the goal is to evoke empathy or mood, photography is superior. If the goal is to teach a protocol or explain a mechanism, the vector workflow layout is objectively more effective.
Assessing Format Versatility and Technical Specifications
The technical composition of the ZIP file containing EPS, JPG, PNG, SVG, and AI formats addresses diverse workflow requirements. Evaluating this asset requires understanding how each format serves different stages of the communication pipeline.
- AI and EPS: These are the master files necessary for deep editing. They allow designers to manipulate anchor points, recolor elements globally, and integrate the infographic into larger print layouts. Without these, the asset is static.
- SVG: Essential for web-based health portals and responsive design. Unlike PNGs, SVGs scale infinitely without pixelation and can be styled via CSS. This is critical for modern healthcare websites that must remain accessible across mobile and desktop devices.
- PNG and JPG: These serve as quick-deployment assets for social media, email newsletters, or internal memos where design software is unavailable. However, they lack editability.
When comparing this package to other market options, verify the inclusion of true vector source files. Many competitors offer only high-resolution raster files marketed as "print ready." While adequate for flyers, these limit long-term adaptability. The presence of native Adobe Illustrator files in this bundle suggests a focus on professional adaptability rather than passive consumption. Users should also consider color mode compatibility; healthcare print materials often require CMYK, while digital uses RGB. A comprehensive template should facilitate easy conversion between these modes without significant color shifting, a common pain point with lower-quality vectors.
Strategic Fit: When to Use Process Timelines for Sleep Data
The Better Sleep Recommendation Infographic is not a universal solution for all sleep-related content. Its utility is highly context-dependent. Recognizing the optimal use cases prevents misalignment between message and medium.
Ideal Scenarios:
- Patient Discharge Materials: When patients leave a clinic, they are often overwhelmed. A five-step linear summary acts as a cognitive anchor, simplifying complex verbal instructions into a tangible takeaway.
- Corporate Wellness Programs: HR departments presenting sleep hygiene to employees benefit from the professional, non-clinical aesthetic. The workflow layout respects the audience's intelligence while providing clear, actionable steps.
- Academic Posters and Presentations: Researchers presenting sleep study methodologies or intervention frameworks need standardized visuals that communicate process flow quickly to peers.
Suboptimal Scenarios:
If the content involves complex statistical data, such as REM cycle variance across age groups, a process timeline is insufficient. Such data requires bar charts, hypnograms, or heat maps. Similarly, if the target audience is pediatric, the linear, corporate-friendly iconography may feel sterile or intimidating. Children respond better to character-driven narratives and vibrant, rounded aesthetics. Additionally, for content focusing on the emotional aspects of insomnia or sleep anxiety, a rigid five-step checklist might inadvertently minimize the patient's struggle. In these cases, softer, more empathetic visual metaphors are appropriate.
Evaluating Information Architecture and Cognitive Load
A critical factor in selecting health infographics is cognitive load management. The Better Sleep Recommendation Infographic employs chunking—a psychological principle where information is broken into manageable units. By limiting the advice to five distinct steps, the design respects the working memory constraints of stressed or fatigued viewers. When evaluating alternatives, count the number of discrete information nodes. Templates attempting to cram ten or twelve tips into a single vertical graphic often result in visual clutter and reduced retention.
However, the five-step constraint also imposes a limitation. Sleep science is nuanced, and reducing hygiene to five points inevitably omits caveats. Users must decide if this simplification serves their educational goal or undermines it. For introductory awareness campaigns, simplification is a feature. For advanced therapeutic education, it may be a bug. Comparisons should focus on whether the template’s information density matches the audience’s prior knowledge level. Furthermore, the linear arrangement assumes a universal sleep experience. Shift workers or those with circadian rhythm disorders may find a standard "evening routine" timeline irrelevant. Adapting the vector elements to reflect non-traditional schedules is possible with the AI/EPS files but requires deliberate effort. Assess whether the default narrative aligns with your demographic before committing to the asset.
Making the Final Selection Decision
Choosing the Better Sleep Recommendation Infographic ultimately depends on balancing efficiency with specificity. It represents a high-value option for organizations needing professional, editable, and structurally sound sleep hygiene visuals without the lead time of custom design. Its strength lies in its adherence to healthcare design standards and its versatile file ecosystem. Its limitation lies in its rigidity and potential oversimplification of complex biological processes.
Decision-makers should audit their current content library against this template’s capabilities. If existing visuals are outdated, pixelated, or tonally inconsistent, this vector package offers an immediate upgrade. If the organization already possesses a robust library of custom sleep illustrations, this template may only serve as a supplementary asset for rapid-response communications. Evaluate the total cost of ownership, including the time required to customize the vector files versus the cost of licensing new stock imagery repeatedly. For many mid-sized healthcare providers and wellness brands, the scalability and professional polish of this specific infographic template provide a pragmatic solution to the ongoing challenge of effective health visualization.